-
This page has some principles and a flow chart that might help you and your students assess situations --
hopefully your students can have enough experience that they can intuitively assess without following a flowchart.
- Principle #1: One trial is not enough!
- Principle #2: The further that the observed warning times are from the crossing time, the more likely it is a Situation of Confidence.
- When we only observe a few samples of warning times, it is extremely unlikely that they represent the far ends of the range of warning times we'd document if we collected data for several hours.
So we should assume that the the full range of warning times is very likely to extend below the shortest warning time that we observed, which means that if any of the warning times are close to the crossing time,
it's very likely that there will be vehicles with warning times less than crossing time.
Conversely, the further from the crossing time that our shortest warning time is, the more likely that the full range of warning times is above crossing time. For example, if the crossing time for the last half of the street is 7 seconds and the shortest warning time for the vehicles observed from that direction is 16 seconds, it would seem to be very unlikely that there would be any vehicle in that situation that could not be detected until it was less than 7 seconds away.
But if the shortest warning time for the vehicles you observed is 10 seconds, it is more likely that in that situation, some vehicles could get less than 7 seconds away belore you detect them, which would mean you are in a Situation of Uncertainty. - CAUTION:
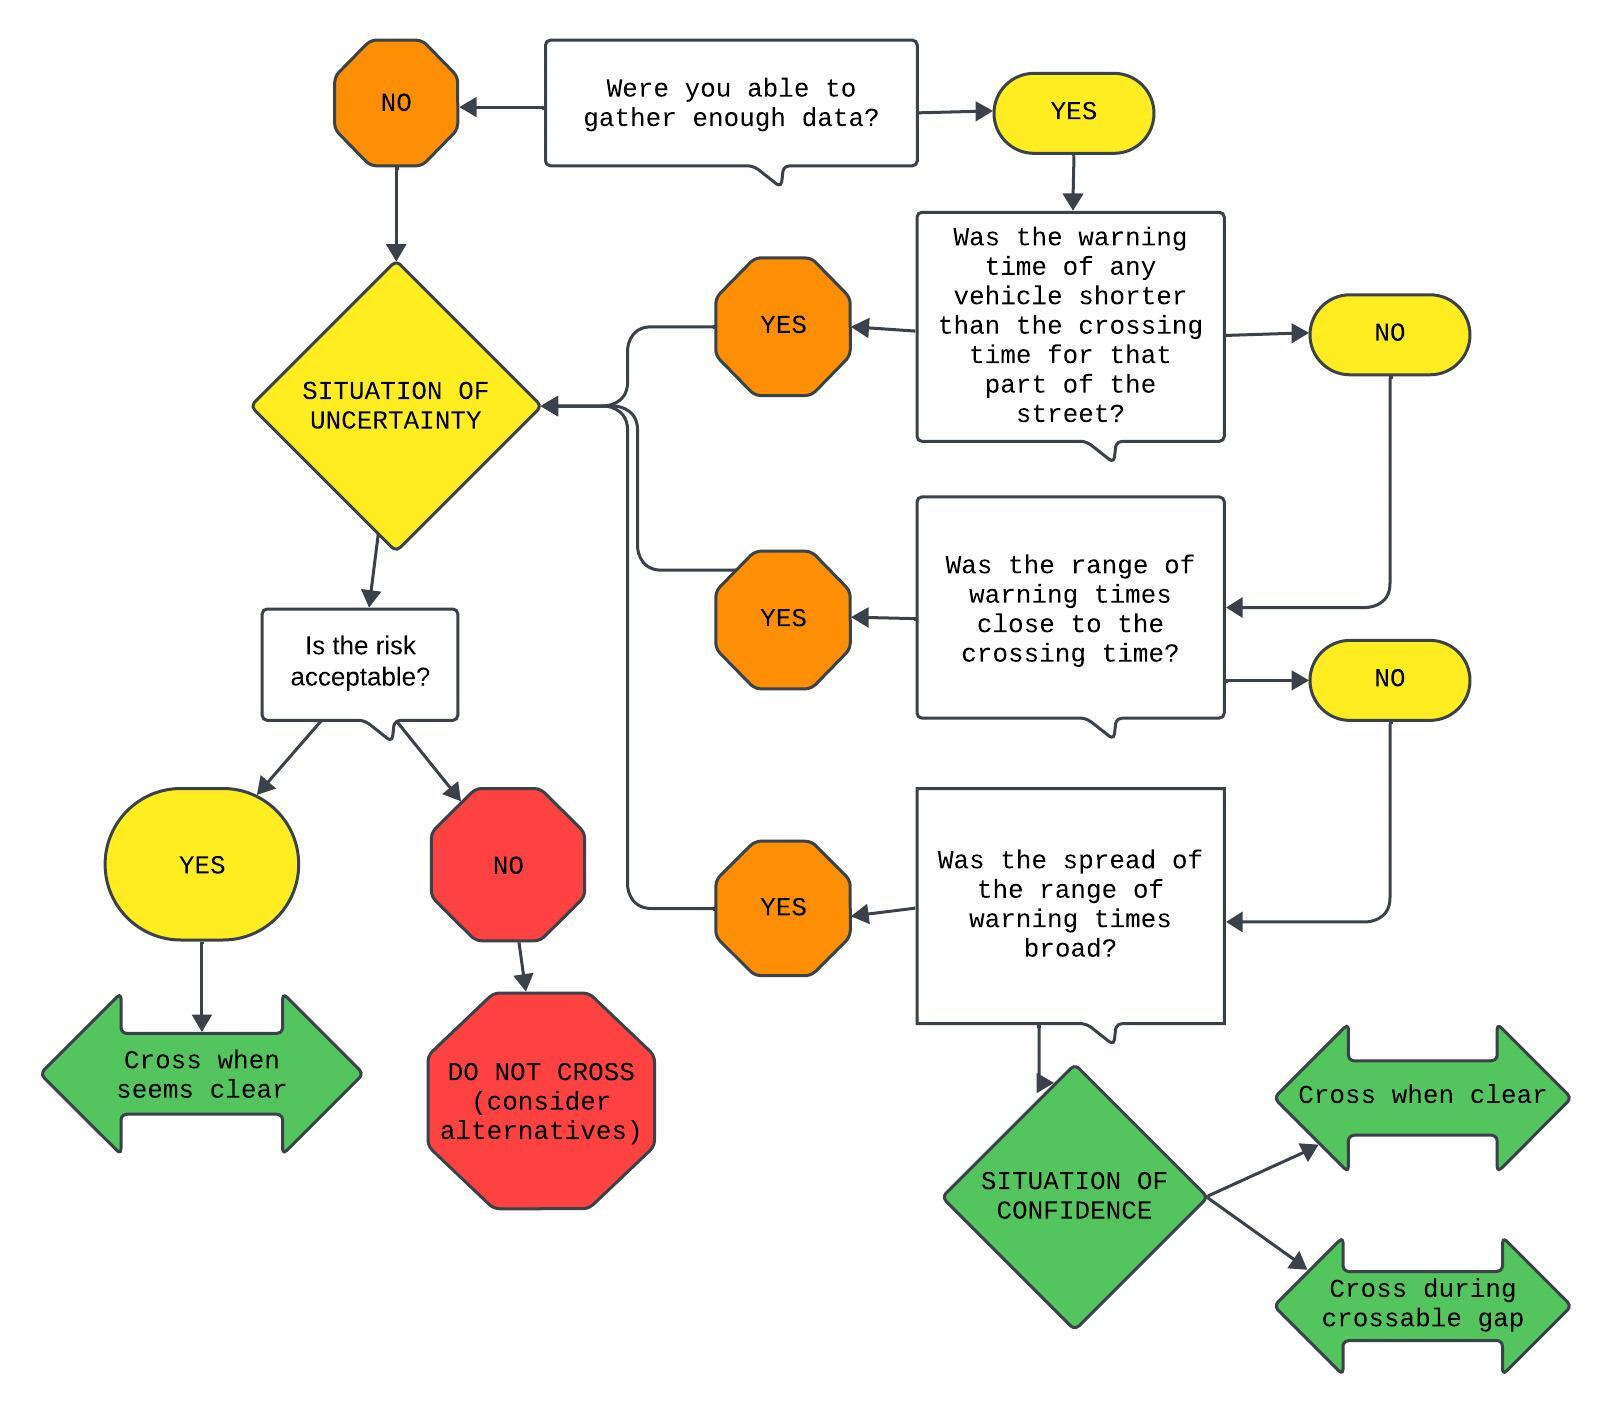
- If NO, then this is a Situation of Uncertainty
- (You don't know anything about the warning time of approaching vehicles heard when quiet or seen when clear.)
- If YES, then continue:
- If YES, then this is a Situation of Uncertainty
- (You cannot be confident that the next vehicle will give you enough warning.)
- If NO, then continue:
- If NO, then this is a Situation of Uncertainty
- (You cannot be confident that the next approaching vehicle has a warning time that is longer than your crossing time).
- If YES, then this is a Situation of Confidence
- (You can be confident that whenever it is quiet/clear, you have time to cross because if there was an approaching vehicle close enough to reach you, it is extremely likely that you would have heard/seen it.)
- If YES, then cross when it seems clear (realizing that you may not have time to cross, but the risk of being seriously injured or killed is low enough to be acceptable).
- If NO, do not cross, because the risk of being seriously injury or killed is too high - consider alternatives.
Meanwhile, you might find this WORKSHEET for Assessing Uncontrolled Crossings, developed by Cindy Lashinkski, helpful to take notes when helping students assess situations.
Principles
-
These principles were developed over years of working with O&M specialists at workshops, and may be helpful to you.
- One sample of the warning time of vehicles from each direction gives you very limited information -- two samples makes it twice as likely that you'll get a sense of the range of warning times that might exist in that situation.
The more samples you have, of course, the more information you gain, but if you need to assess the crossing each time you come to it, you may need
to weigh the benefits of having a wide sampling with the need to make a quick assessment.
- If the sound of the approaching vehicles disappears after they were first detected, the range of detection-to-arrival times can be misleading.
You'll find out more about this and a suggestion for addressing the problem in Section 5's "Freaky Findings."
|