AFB JOURNAL OF VISUAL IMPAIRMENT& BLINDNESS
December 2008 • Volume 102 • Number 12
JVIB, Copyright © 2009 American Foundation for the Blind. All rights reserved.
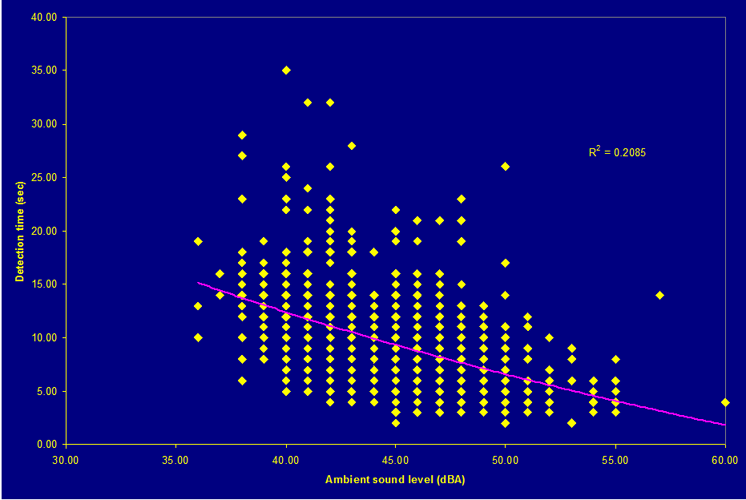
Figure 2.
Correlation between ambient sound level and detection time in the straight condition. Click here for description
General Description:
This figure shows the ambient sound level and the detection time (in seconds). When the ambient sound was the quietest (35 dBA), the vehicles were heard an average of 15 seconds away, at ambient sound of 45 dBA the vehicles were heard an average of 10 seconds away, and at 55 dBA the average vehicle was heard only 5 seconds away.
Details:
The figure is a scatterplot. The x-axis is labeled Ambient sound level (dBA) and has 7 values, from left to right: 0, 10, 20, 30, 40, 50, and 60. The y-axis is labeled Detection time (sec) and has 9 values, from bottom to top: 0, 5, 10, 15, 20, 25, 30, 35, and 40. A bar runs through the graph from about 35 dBA to 55 dBA with a range of 17-7 seconds detection time. Black diamonds are plotted heavily along this line, with a few outliers; for example: 40 dBA and 35 seconds of detection time, 50 dBA and 25 seconds of detection time, and 35 dBA and a range of 10–20 seconds of detection time.
JVIB, Copyright © 2009 American Foundation for the Blind. All rights reserved.
Return to article
Return to Home page